


Let AI summarize this article for you


The full process — from category role to measuring the effect of a change
For a retailer with ten stores, assortment management is an analysis problem: one person looks at the numbers and decides. For a chain of 80, 200 or 500 stores it becomes an operational discipline that touches commercial strategy, supplier negotiation, replenishment and execution control at once. Between the assortment decided at head office and the one actually present in stores a gap opens, and that gap is where margin leaks.
An assortment is the set of items a retail banner offers in a store or a group of stores. An item (SKU) is the single unit of product distinguishable by brand, format and variant. An assortment matrix is the list of items a category provides for a group of stores in a given period, with reference quantities by segment. Keeping it coherent across dozens of categories and several store groups is the real difficulty of a chain.
Most guides to the best category management software compare interfaces and feature lists. This guide starts from the whole process instead: from defining category roles to clustering stores, from item selection to measuring the effect of changes.
What does the assortment review process look like?
Before evaluating software, map the process it will have to support. A full assortment review runs through seven stages:
- Category role and objectives — what the banner expects from that category and which metric measures it.
- Store clustering — which stores can share the same assortment matrix.
- Structure and quotas — how many items the category carries and how they split across segments, price tiers, brands and private label.
- Item selection — listing and delisting based on each item’s contribution within its cluster.
- Approval and negotiation — the proposal goes through commercial management and meets the supplier negotiation.
- Store-level application — the approved matrix becomes real assortment, with the local exceptions that follow.
- Measurement and review — checking the effect and correcting the rules for the next cycle.
The windows in which the process has to close are not a single one and do not coincide: annual contract negotiation, private-label negotiation, the promotional plan and short-cycle categories each follow their own calendar, and a review proposal is only worth anything if it lands before the window it is aimed at.
Each stage involves different people: category management, buyers, commercial management, store operations, retail IT. The inputs are the item master with its attributes, receipt-level sales, margin, stock, shrinkage and write-offs, store characteristics and supplier contract terms. A tool that covers only stages 3 and 4 leaves the other five to spreadsheets, email and meetings.
| Stage | Who decides | Data required |
|---|---|---|
| Category role and objectives | Commercial management | Category weight in revenue and margin |
| Store clustering | Category management | Sales by segment, store by store |
| Structure and quotas | Category management | Normalised item attributes |
| Item selection | Category management | Normalised contribution by cluster |
| Approval and negotiation | Commercial management and buying | Contract terms and availability |
| Store-level application | Store operations | Physical capacity and local constraints |
| Measurement and review | Category management | History of decisions taken |
What features does category management software need for a multi-store chain?
When evaluating any tool, this is the checklist:
- Clustering on sales behaviour, not only on the store record. Some tools group by format, size and geography; others by the demand structure observed inside a single category. The first kind returns a segmentation the banner can already produce on its own.
- Grouping definable per category. Some tools allow a different grouping for each category; others work on one chain-wide segmentation and reuse it everywhere. The second case is often presented with the vocabulary of the first.
- Normalisation of item contribution. The system must relate contribution to the number of stores where the item is present and to its actual period of presence. A ranking built on absolute revenue proposes every new item and every partially distributed item for delisting.
- Separating weak demand from chronic unavailability. An item that is frequently missing sells little because it is not there. A tool that does not separate the two cases proposes removing products that perform when present.
- Structure quotas as an active constraint. Minimum percentages by segment, price tier, brand and private label must live in the system and raise a flag when the real assortment breaches them, not sit in a separate document.
- Category role connected to the calculation. If changing a category’s role changes nothing in the output, the role is a descriptive label and deviation checking does not exist.
- Reasoning exposed at single-item level. A list of items to add and remove without the reason is not defensible in front of commercial management, and not presentable to a store that can decline it.
- Decision history. Which decision was taken, when, on which stores and with what reasoning. Without this, the effect of a change cannot be reconstructed afterwards and the next review restarts from opinions.
- Protection for new items. A configurable rule that excludes recently introduced items from delisting, because a short history does not distinguish a weak product from one that has not yet built its rotation.
- Recalculation time compatible with the commercial calendar. Recalculating a category is a commercial requirement rather than a technical characteristic: it should be measured on the retailer’s data volume, not on a demo environment.
What types of assortment management software exist?
No product covers this checklist equally on every point, because the tools on the market grew out of different problems. Knowing which class a product belongs to tells you in advance which items it will cover well and which will stay its weak spot.
| Tool class | What it covers | What is usually missing |
|---|---|---|
| Spreadsheets | Anything, up to a volume limit | Retaining the rules, recalculation across all clusters, traceability |
| Business intelligence systems | Representing the state of categories and items | The structure rules, the listing and delisting proposal, decision history |
| Assortment modules inside ERP suites | Master data, the matrix as a list, contract availability | Demand-based clustering, quotas as active constraints, contribution scoring |
| Space planning software with assortment features | Physical store capacity and translating assortment into display | Category roles, contribution scoring by cluster, the review calendar |
| Dedicated category management platforms | The process from category role to effect measurement | Require normalised product attributes to work |
Spreadsheets hold up as long as the number of decisions to recalculate fits the window available before the negotiation the review is aimed at. The load is estimated by multiplying categories managed by store clusters by review frequency: forty categories, four clusters and two reviews a year make three hundred and twenty structure recalculations. What breaks the spreadsheet is the ambition of the segmentation more than the size of the chain.
Business intelligence systems show the state of the category without retaining the rule it should follow. They see that the premium segment weighs eighteen per cent, but they do not know it should have weighed twenty-five, because that threshold lives in a document. This is why they raise no flag on the breach, produce no listing and delisting proposal, and keep no record of why an item was introduced.
Assortment modules in ERP suites treat the matrix as a list to maintain. They know which items exist and on what terms, which makes them indispensable downstream, but they pass no judgement on which should stay.
Space planning software starts from the physical store and works up towards assortment. It covers the capacity constraint well and translates decisions into display; scoring an item’s contribution by cluster and running the category review cycle sit outside its original scope.
Dedicated platforms cover the whole process, with one condition worth stating: they work on item attributes, and on a catalogue with incomplete attributes they produce recommendations that are formally correct and commercially weak. This is the class Retano CatMan belongs to, described further below.
What impact can be expected?
Across the implementation projects delivered, Retano reports average values of 3% revenue growth, a 7% reduction in stock levels and a 35% reduction in manual planning workload.
The outcome depends on much more than the software, and the variables at play say more than the figure. Starting data quality matters, and in particular how complete and normalised the item attributes are. The previous level of automation matters: a chain that ran everything in spreadsheets gains more in time than one that already had a structured process. So do the number of categories actually brought into the system, how often assortment is reviewed, and how much of the recommended matrix is then applied in stores.
Two clarifications keep expectations calibrated. The effect shows up in the categories and stores actually worked on, not in total chain revenue. And assortment planning does not replace replenishment or inventory management: the commercial result is joint, and attributing it entirely to the assortment review leads to mismeasuring the following cycles as well.
What does category management software not do?
A category management system produces a proposal for the composition of the assortment. Everything before and after that proposal sits outside its scope.
It does not negotiate with the supplier: it calculates that an item should be introduced, but the terms on which it enters are decided elsewhere. It does not set price or promotional pressure, which affect category results more than many assortment choices. It does not guarantee that the proposal is executed in stores. And it does not infer from sales data alone which items are substitutes for each other: that reading depends on attributes, and a vendor claiming otherwise is promising something the retailer will not be able to verify.
There are also four conditions in which buying arrives too early. Product attributes are not filled in consistently, and the system would have nothing to calculate on. Category roles have not been assigned, and there is no benchmark against which to measure deviation. Review happens once a year across all categories at once, and the load remains manageable. The chain has one store per catchment area, and clustering has nothing to work with. In these cases the first useful investment is master data and process, not software.
How much does this vary across European markets?
European retail does not have a single operating model, and the two variables that matter most for choosing software both run along a wide range: how binding the assortment matrix is, and how much of the category the retailer’s own brand occupies. Rather than an average, what a buyer needs is to know where their own organisation sits on each range.
How binding is the assortment matrix?
At one end of the range sit chains under single ownership, where head office runs the stores directly and the assortment matrix is an instruction. At the other end sit buying groups and cooperatives of independent retailers, where the store belongs to its operator and the matrix is a recommendation that can be declined without any mechanism preventing it. Both models exist across Europe, often side by side in the same country, and Italy, Germany and Spain each show a different mix.
The position on this range changes the selection criterion, not just the deployment. Where the matrix is binding, the quality of the calculation engine is what matters and the output can go straight to execution. Where it is a recommendation, the recommendation has to be explainable to its recipient: a list of items to add and remove, without the reason an item is leaving, is applied partially or ignored, and the gap between recommended matrix and real assortment widens with every cycle until the calculation becomes useless.
For a buyer at the recommendation end of the range, the indicator to look at is not how accurate the recommendation is, but what share of recommendations actually gets applied in stores. It is worth asking a vendor directly whether the product was designed for single-ownership chains, because most were.
How much of the category does private label occupy?
Private label is the set of items sold under a brand owned by the retailer. Within the structure of a category it works as a margin and differentiation lever, and its share is set as an objective before assortment composition is calculated. For that reason private label belongs in the system as an attribute with its own quota per cluster, alongside price tier and format.
The range across Europe is wide and worth locating precisely. According to Circana, measured in units over the twelve months to December 2025, private label crossed 50% of units for the first time across the six largest European FMCG markets taken together. Within that group Spain leads at 59% and the Netherlands follows at 56%, the United Kingdom and Germany both stand at 52%, France at 46% and Italy at 36%. The same analysis notes that 34% of manufacturer-brand units were sold on promotion against 14% of private-label units.
A twenty-three point spread between the top and bottom of that list is not a nuance: it changes what a category structure looks like. It also means figures quoted for one market cannot be reused for another, and that value share and unit share are not interchangeable. Before a private-label target quota is configured in any system, the perimeter and the metric have to be fixed, and target and control have to use the same basis.
What shared methodology do retailers and suppliers use?
When a category role has to be named so that a supplier understands the same thing by it, the common reference across European markets is the ECR category management model, developed by retailer and manufacturer working groups and maintained nationally by the GS1 member organisations. The model structures the work as a sequence of stages, from strategic alignment through defining the category, assigning its role, performance assessment, objectives, strategies, tactics and review. National versions differ in the number of stages and in the naming of the roles, so it is worth checking which nomenclature is in use before configuring a system that will have to reproduce it.
The operational consequence of the role concerns assortment width. A category in which the customer looks for depth supports a higher number of items; a category bought as a complement loses effectiveness if it is widened, because choice gets more complicated without the customer having asked for it.
How does Retano CatMan cover this process?
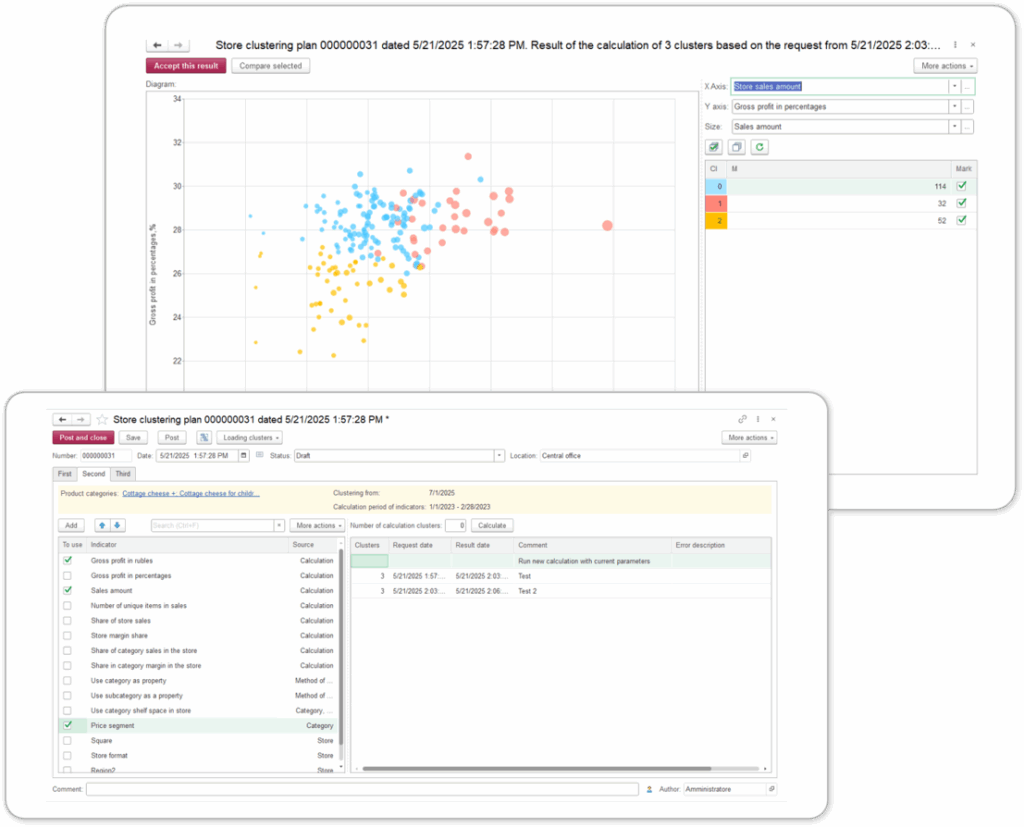
Retano CatMan is a category management system that turns receipt-level sales, item attributes and AI forecast into structured assortment decisions at cluster level. It covers stages two to seven of the process mapped above, leaving master data and transaction recording to the ERP.
Store clustering works on real sales data, on store characteristics and on the behaviour of the individual category, and produces separate matrices for each group: the cluster map of one category does not have to match that of another within the same banner.
Category structure is governed through minimum shares by subcategory, price tier, brand tier, format, private label and country of origin. These quotas act as a constraint on selection rather than as a parameter in a ranking: a tier or a brand the retailer considers strategic stays represented even where ranking by performance would reduce it.
On item selection the system produces listing and delisting recommendations from sales history and sales forecast, delivered together with the reasoning and with the difference against the matrix in force, so the category manager can check why an item was flagged rather than accepting the output. The decision stays with them. New items go through a protected period while history builds, and are not scored by the criteria applied to established items.
On category role, the comparison between planned strategy and real behaviour is a standing one and returns the store clusters that have drifted from it, along with duplications and segment imbalances.
The sales forecast is produced by the system itself, through a dedicated machine learning model, and is used to build the target assortment rather than simply reflecting what the category sold in the past. It is a forecast for assortment purposes: how much a candidate item is expected to contribute within a cluster over the planning horizon. Operational forecasting for ordering and replenishment remains the job of a separate system.
What to ask every vendor
| Question | What a weak answer means |
|---|---|
| Where do product attributes come from, and what happens if they are incomplete? | If the answer is that the system derives them by itself, the vendor is underestimating the master-data work that will fall on the retailer |
| Can store grouping be defined per category, or is it single for the chain? | An evasive answer indicates a chain-wide segmentation reused everywhere, presented with the vocabulary of per-category clustering |
| What basis is an item’s contribution referred to before it is ranked? | If the answer does not name stores of actual presence, period of presence and cluster, the ranking confuses performance with distribution |
| How does it behave on a category with short history or newly introduced? | If there is no specific treatment, new items will be judged on a phase that does not represent them |
| For a single item, does the system show the reason behind the recommendation? | If it shows only the outcome, the proposal is not defensible in front of commercial management |
| How are different banners configured within the same group or buying organisation? | If the answer describes a configuration to replicate per banner, the maintenance load will fall on the central team |
| On what perimeter and with what metric is the private-label quota defined and controlled? | If the system admits only one definition, target and control will be measured on different bases |
| What changes in quotas and recommendations when a category’s role is modified? | If nothing changes, the role is a descriptive label and deviation checking is not possible |
| Who can change thresholds and constraints after go-live: the retailer or the vendor? | If every change needs vendor intervention, calibration against real categories will not happen |
| How does it treat chronic unavailability of an item? | If it does not separate that from weak demand, the system will propose delisting items that sell when present |
| Does the product work where the matrix is not binding on the store? | If the question has never been put to the vendor, the product was designed for single-ownership chains |
| A cycle later, how is it reconstructed why an item was listed or delisted? | If the reasoning lives only at the moment the recommendation was produced, the next review restarts from opinions |
How is implementation structured?
A sound implementation runs in phases, and the first one is not about software.
Phase 1 — data and attributes. Define which attributes matter for each category and bring them to consistent completion, starting with the categories carrying the most revenue and normalising three or four attributes at a time. In parallel, verify the flows from the ERP: receipt-level sales, margin, stock, shrinkage and write-offs, over a period covering at least one full seasonal cycle. A project that waits for the item master to be complete before starting never starts. One that starts without attributes produces indefensible recommendations.
Phase 2 — clustering and structure. Bring the first categories into the system: store grouping, roles, quotas by segment and attribute, and the first comparison between planned and real structure. This is the phase where thresholds are calibrated, starting from expert values and corrected against the retailer’s own data.
Phase 3 — selection and measurement. Listing and delisting recommendations come in, along with a review calendar aligned to each category’s negotiation windows and effect measurement by comparison between clusters. Here the loop closes. The rules set in phase 2 are checked against the result and corrected, rather than reconfirmed by inertia.
Change management runs across all three phases. Commercial management has to recognise itself in the role model, the category team has to know where the recommendation ends and the decision begins, and ownership of the product master has to be assigned explicitly, with a defined refresh cadence.
How does assortment connect to physical store space?
Assortment composition is decided first and its physical placement second, and the two processes use different tools. A category management system establishes how many items a category provides in a cluster and which ones; how many actually fit in the store is a question of display space, governed by the space planning software that produces the planogram.
The two levels have to communicate in one specific direction: physical capacity is an input constraint for assortment planning, or the calculation proposes matrices that do not fit real stores. Store space management is covered by Retano Shelfplan, and the relationship between category strategy and space planning is set out in more detail in the dedicated FAQ.
FAQ
What is category management software?
Category management software is a system that turns sales and assortment data into decisions about assortment composition: how many items to carry in a category, which ones, and in which stores. It retains the structure rules the retailer has defined and checks that the real assortment complies with them, cluster by cluster.
How is it different from a business intelligence system?
A business intelligence system represents the state of the chain: it shows that a category has lost margin. Category management software retains the rule that category should follow, flags which items breach it and produces a listing and delisting proposal. The first describes, the second decides.
How many stores does a chain need for this to be worthwhile?
The threshold is not the number of stores, but the product of categories managed, clusters per category and review frequency. A chain with few stores and many categories reviewed twice a year passes the limit of manual calculation before a larger, more static one does.
Who decides the category role, the system or the category manager?
The retailer decides. The system retains that decision, translates it into structure constraints and checks that the real assortment complies, flagging deviations. The choice stays commercial; what gets automated is verifying that the category behaves as it was defined to.
What data are store clusters built on?
On sales behaviour observed inside the individual category: how demand splits across segments, store by store. Format, size and geography remain as constraints, but used alone they produce groups that are homogeneous on the store record and heterogeneous in real demand.
Does it work where the assortment matrix is not binding on the store?
Yes, but the evaluation criterion changes. Where the store belongs to an independent operator, the matrix is a proposal rather than an instruction. What then matters is how explainable the recommendation is: without the reason an item is leaving, it gets applied partially or ignored.
What data does a retailer need before starting?
Receipt-level sales, margin, stock, shrinkage and write-offs, the item master and category attributes, over a period covering at least one full seasonal cycle. The most frequent obstacle is not missing sales data, but product attributes that are incomplete or not normalised.
See the process on a real category
Two things separate tools in this class, and both are checked on screen rather than on a feature sheet: what basis an item’s contribution is referred to before it enters a ranking, and whether the reasoning behind a single recommendation is visible to the person who has to act on it. In the demo a functional expert shows how each is built in the interface, on a live category.
Glossary: key category management terms
Assortment — the set of items a banner offers in a store or a group of stores.
Item (SKU) — the single unit of product distinguishable by brand, format and variant, identified by its own code.
Assortment matrix — the list of items a category provides for a group of stores in a given period.
Category — a set of items the customer treats as alternatives or complements in meeting the same need.
Category role — the commercial function a banner assigns to a category, establishing what is expected from it.
Store cluster — a group of stores receiving the same assortment matrix because it shows the same demand structure.
Category quota — the minimum or maximum percentage a segment or attribute must represent within the category.
Listing — the decision to bring an item into the assortment matrix of a group of stores.
Delisting — the decision to remove an item from the assortment matrix of a group of stores.
Assortment rationalisation — the review of a category’s composition aimed at removing overlaps and items of insufficient contribution.
Private label — the set of items sold under a brand owned by the retailer.
Rotation — the speed at which an item is sold and replaced, measured on the ratio between sales and average stock.
Category performance — a category’s overall result read across margin, rotation, penetration and shrinkage.
Cannibalisation — the situation in which several items compete for the same demand instead of adding to it.
